Developing a Personal Finance desktop application in Java, with Java Swing and PostgreSQL.
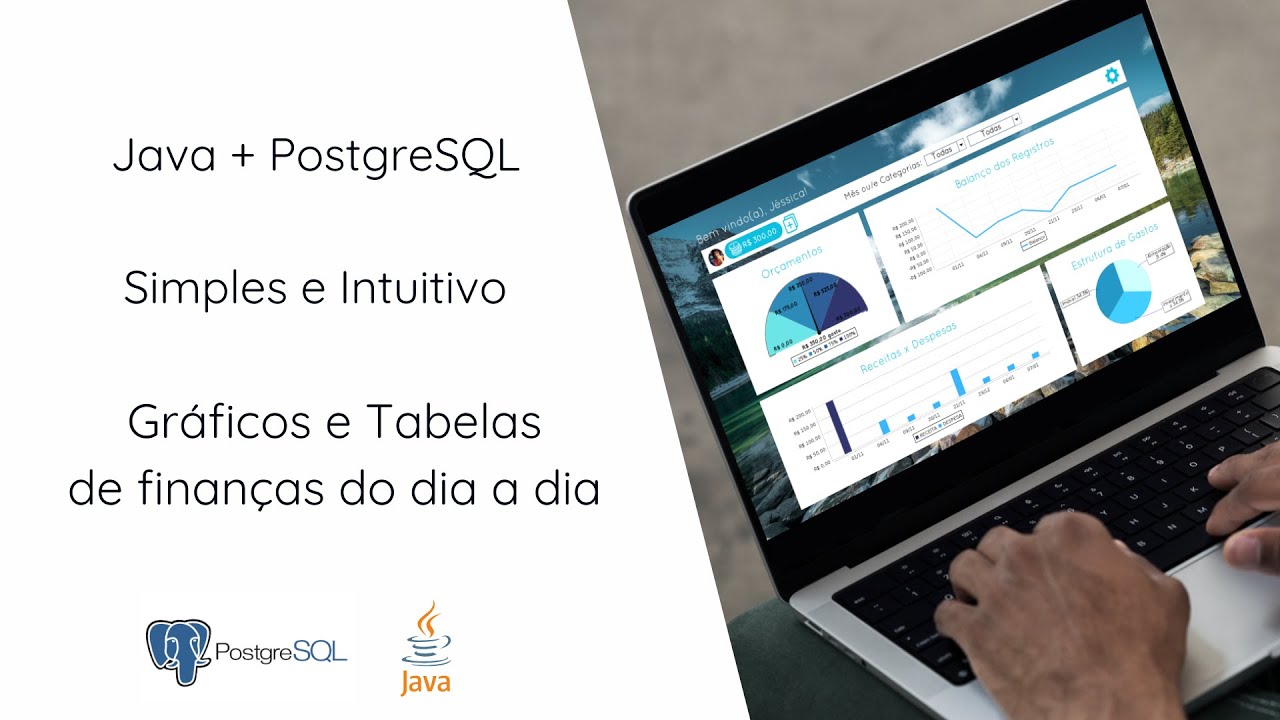
In the Object-Oriented Programming course taught at my university (Santa Catarina State University - UDESC), the final individual project proposal was to implement a software application in three stages. In the first phase, the data and business layers were modeled and implemented in Java; in the second, the graphical user interface. Finally, in the third stage, the design and implementation of the database for the application took place, referred to as persistence.
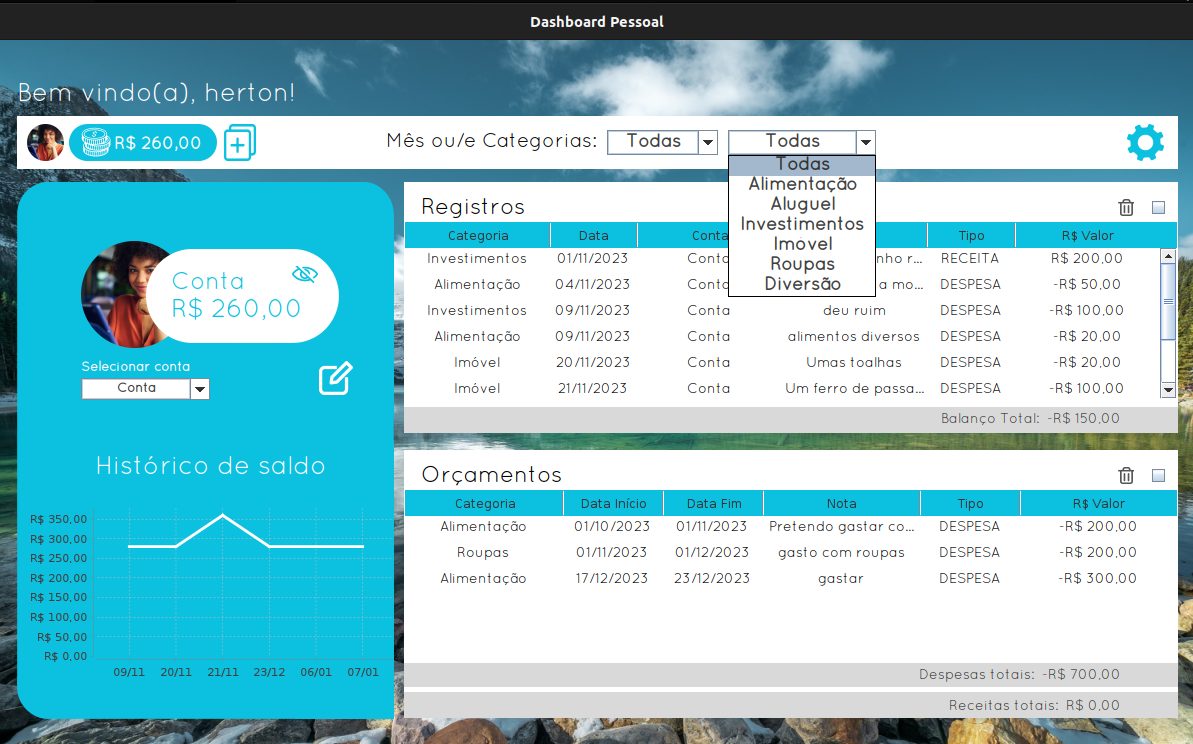
In this post, I will detail the project stages, from backend to frontend, with the theme of a Finance System. It is a moderately complex application designed to be a personal finance management software. In this application, users add their income and expenses under specific categories, allowing the program to:
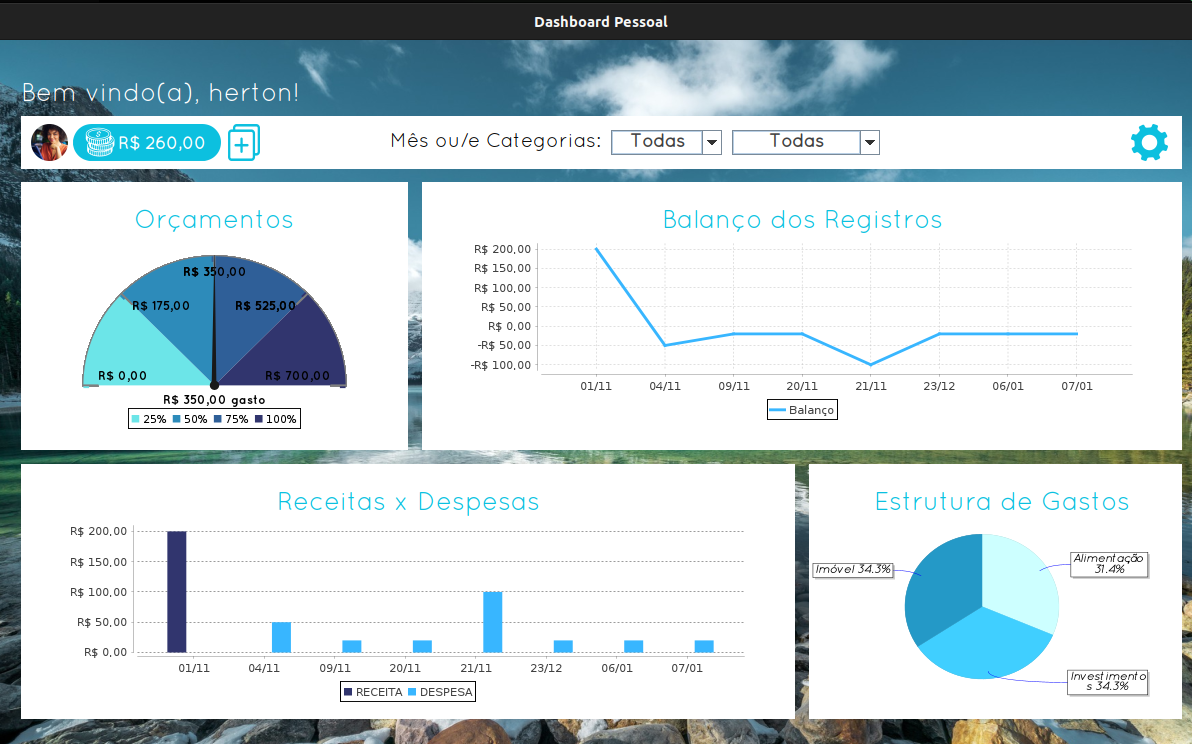
- Plot charts and generate estimates based on the user’s financial income and expense data on the main dashboard.
- Enable users to manage and monitor their financial transactions through record histories within their own predefined categories.
- Provide an intuitive, easy-to-use interface incorporating user experience (UX) elements.
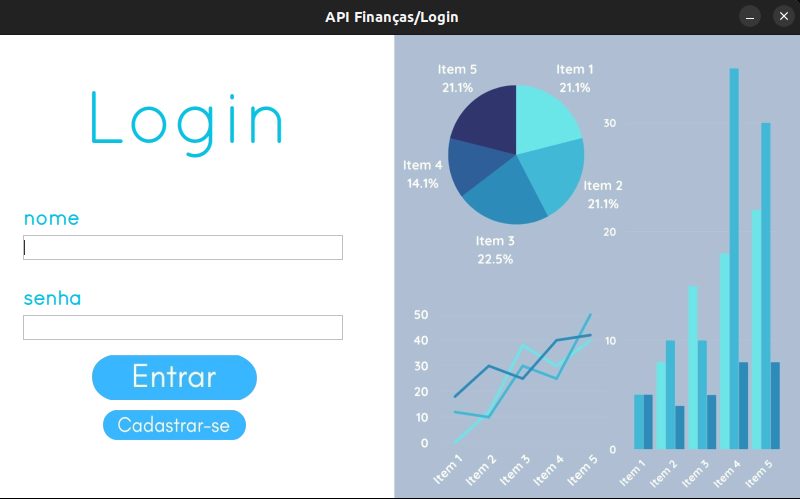
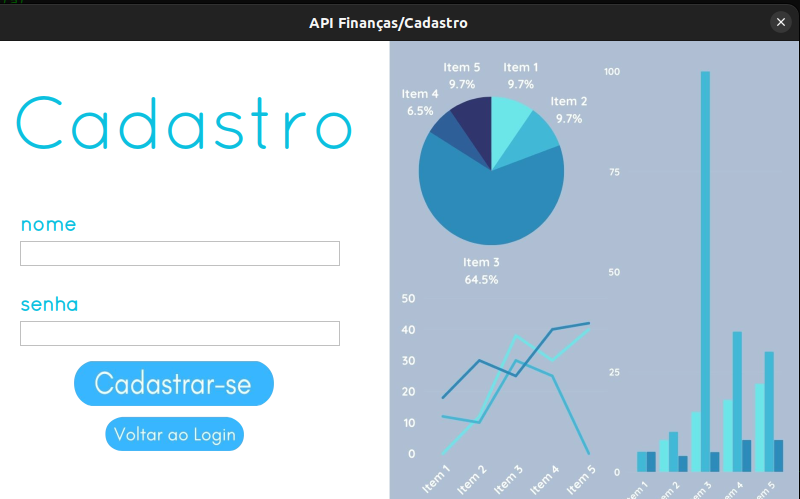
- Feature an authentication system (login and registration).
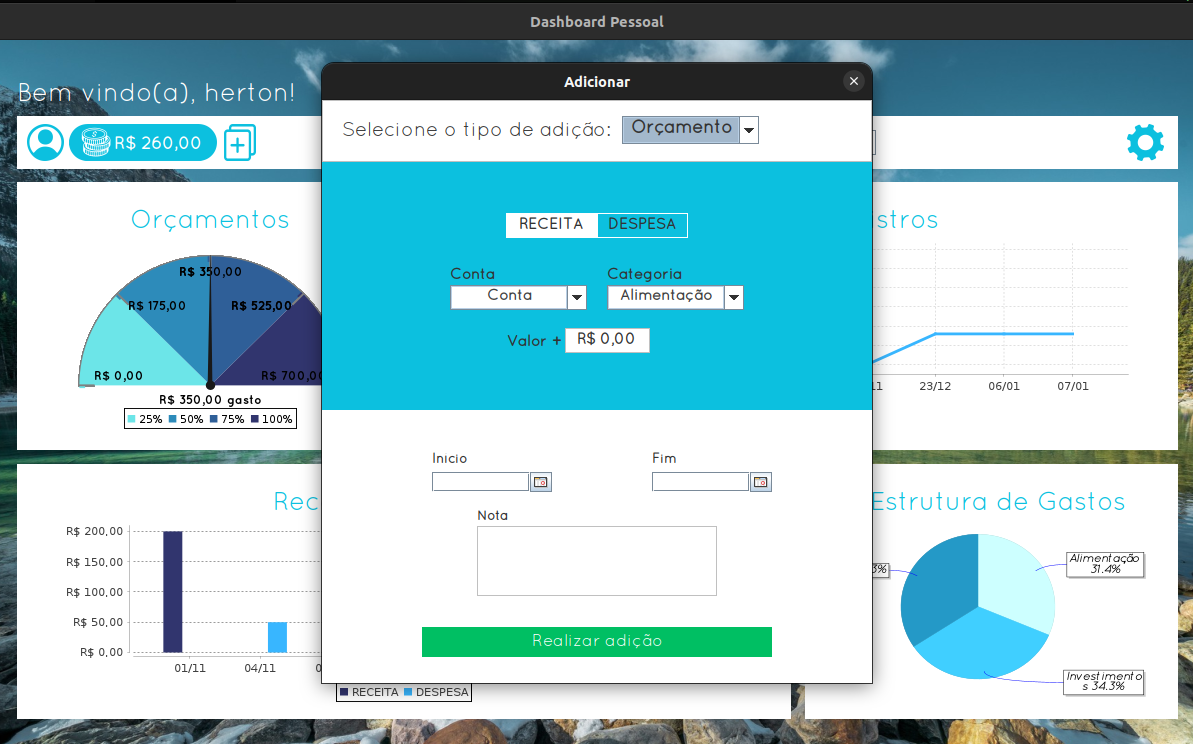
- Allow income/expense forecasting through budgets added by the user.
Backend Architecture
The Database
Initially, the tool used for data persistence is PostgreSQL. According to official documentation, PostgreSQL is an object-relational database management system capable of supporting core database features such as complex queries, foreign keys, multiversion concurrency control, as well as the addition of custom data types, functions, and more.
Upon deeper analysis, the project’s organization into tables representing the data layer classes stands out, designed to store the objects that the program will manipulate along with their attributes and methods. Furthermore, the traditional and efficient UML (Unified Modeling Language) class diagram was chosen as the language to document and visualize the database.
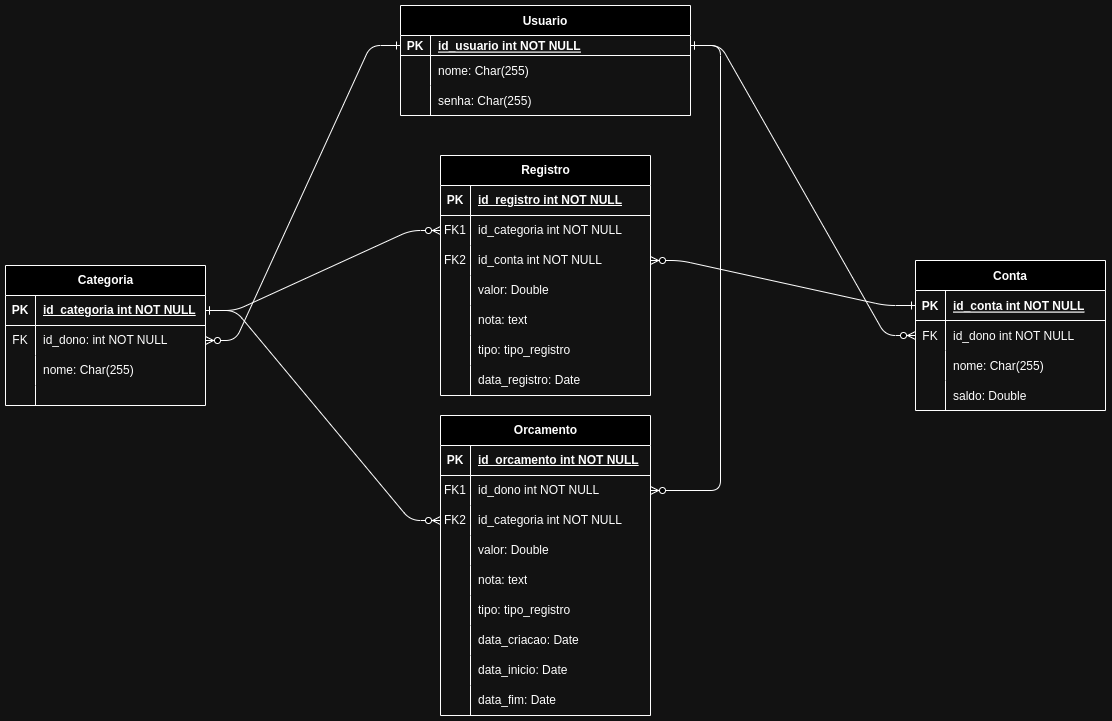
Therefore, the UML class diagram above represents the organization of data in the database, including the cardinalities that represent relationships between the User, Account, Category, Record, and Budget tables. This provides an organized visualization of the data structure. For example, the Record table has two foreign keys (FK): one referencing the account and another referencing the income/expense category of that record. Additionally, the Account table references a user from the User table, who is the account owner who created the record.
Encapsulation and the DAO Design Pattern
Generally speaking, establishing a database connection and performing CRUD (Create, Read, Update, and Delete) operations on tables seems straightforward at first. All it takes is consulting the official documentation of the library being used, following the connection steps, downloading the required driver into the lib folder, and writing a few lines of code including information such as username, password, and database path.
However, depending on the project and if done incorrectly, the code can become messy, with multiple database connections scattered across layers that were not even designed for that purpose. This can lead to future errors and make code maintenance difficult. With that in mind, this project adopts the DAO (Data Access Object) pattern, which, although relatively simple, has proven to be highly effective, significantly simplifying the implementation process.
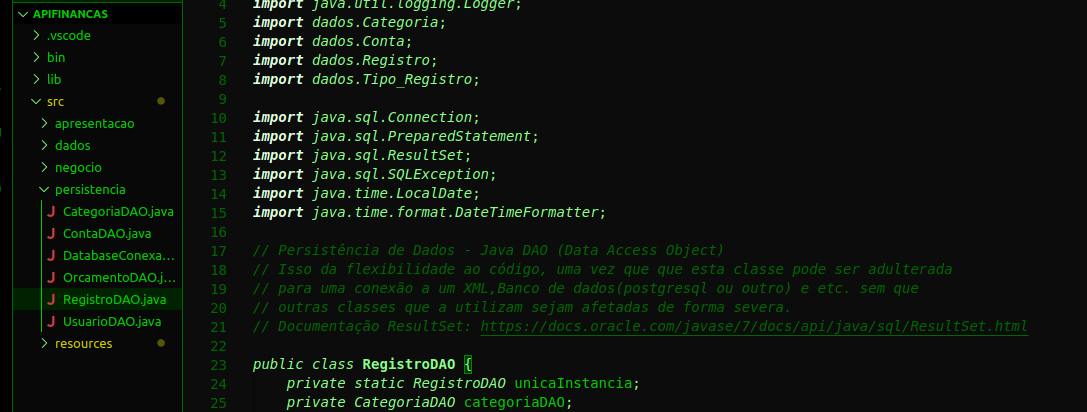
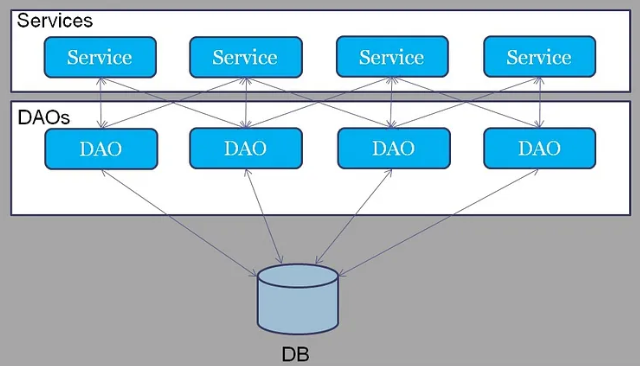
In short, this pattern consists of creating a DAO class for each domain object, and each of these classes will contain the corresponding CRUD operations, communicating with the database and encapsulating data access. Thus, by also utilizing the singleton pattern—where only a single instance can be created for each class—the project not only becomes more organized and clean, but also limits unnecessary database connections, leading to more efficient optimization.
The final database structure looks like this:
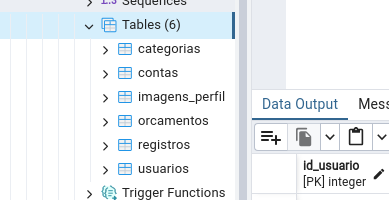
The System
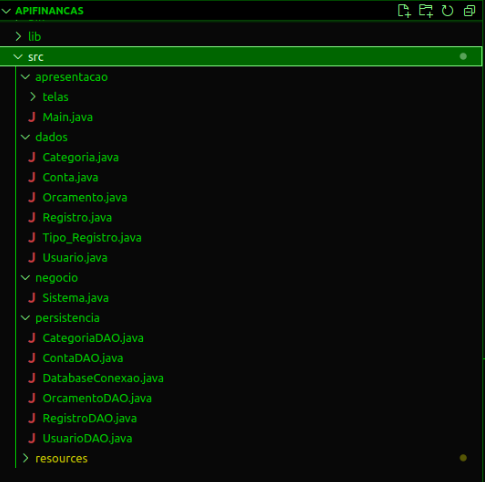
In the business layer, the application logic acts as a bridge, connecting to the DAO layers to enable persistence, access, or removal of specific data for the presentation layer. Operations such as registration, validation, and deletion of each program object are handled by the Sistema class in this layer. This approach enables efficient integration with the visible layers of the application, such as login screens, registration screens, etc.
The overall project structure looks like this:
User Experience
Color Palette, Shapes, and Typography
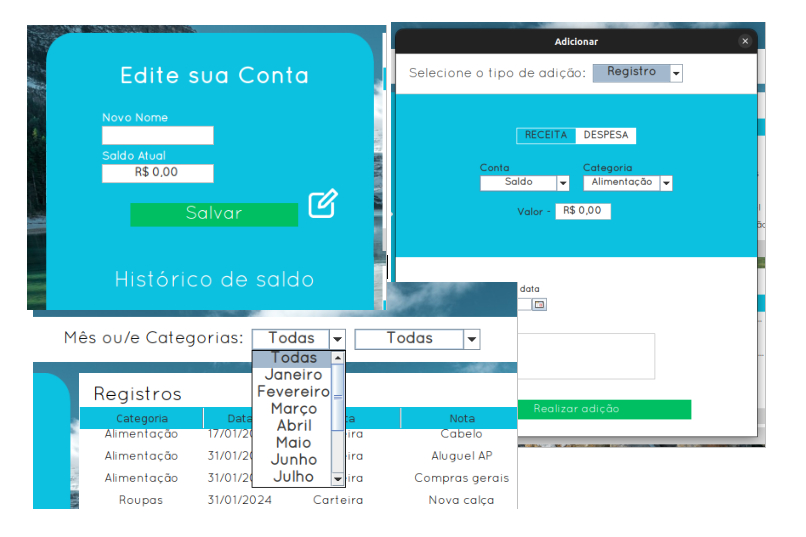
The first step I decided to take when building the interface for this application (presentation layer) was creating a visual identity to be used across all program windows. This way, the application has consistent icons, a color palette, typography, and several other graphical elements that are essential to giving the project personality.
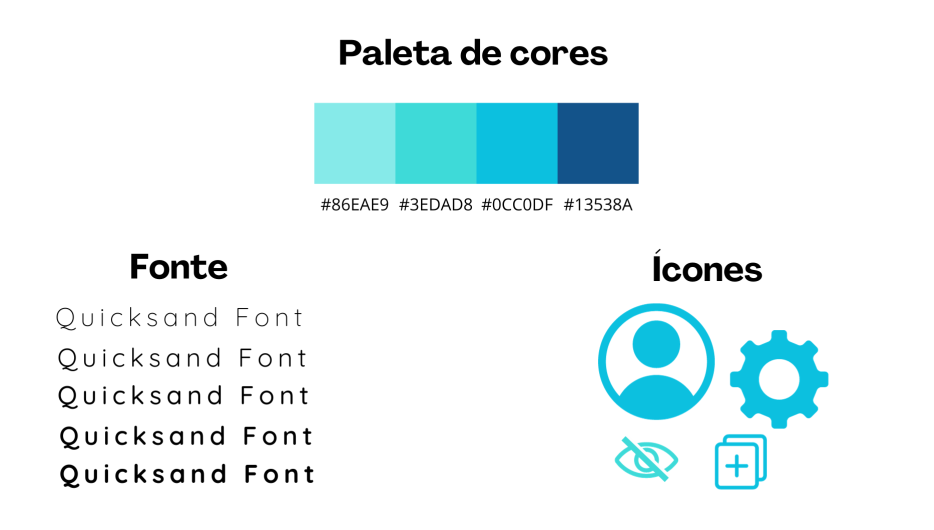
The color palette consists of blue tones present throughout the interface, whether in buttons, text, backgrounds, or borders. Likewise, the chosen font is used in most highlighted text, as well as the icons, which follow the same consistent patterns.
Intuitive Windows and Design
The intention behind each window or feature was to make them intuitive, aiming for a look and feel similar to modern desktop or web applications, using HTML and CSS as references. However, Java Swing, the toolkit used here, does not natively provide layouts with elements as modern as newer frameworks, which made the design process somewhat more challenging. For instance, components such as buttons, combo boxes, or text fields have an outdated default appearance and are harder to customize, but I customized them as much as possible to achieve a modern, minimalist look.
Charts and Tables
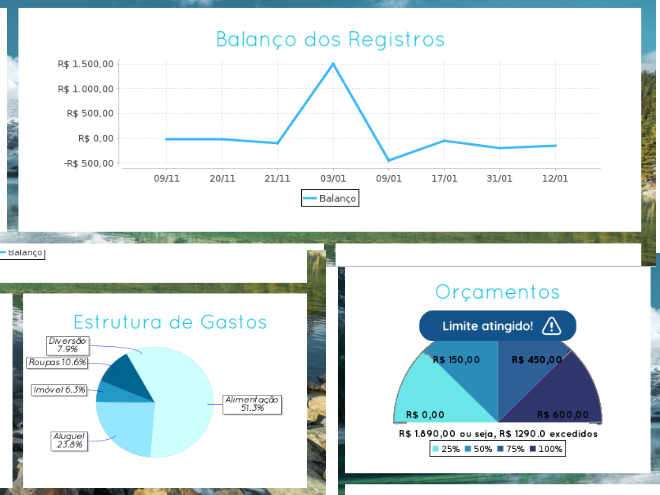
The charts on the main dashboard were built using Java’s JFreeChart library, which offers a variety of models such as line charts, bar charts, radial charts, and more. Selected data is fed into the X and Y axes, representing the user’s financial records, and is filtered and updated dynamically throughout the application. Additionally, tables are updated alongside the charts, reflecting changes made by the user in the filter settings.
Conclusion
In summary, this project, partially ready for a beta phase, would ideally include: an executable tested on at least a few Linux and Windows machines, an efficient encryption implementation, a suite of performance tests, and releasing a beta download for user testing. However, each of these topics is complex enough to require several months of study and would warrant a dedicated post on this blog if implemented by a single person (myself), which isn’t feasible at the moment. Therefore, more study time needs to be dedicated to this project, which will lead to more learning as well as further hands-on practice with Java.
Repository link on my GitHub - https://github.com/hertonnn/API-Financas
References
- PostgreSQL Documentation - https://www.postgresql.org/docs/current/intro-whatis.html
- Object-Oriented Programming (IBM) - https://www.ibm.com/docs/pt-br/watsonx-as-a-service?topic=language-object-oriented-programming
- UML - https://www.microsoft.com/pt-br/microsoft-365/business-insights-ideas/resources/guide-to-uml-diagramming-and-database-modeling
- DAO Pattern - https://www.macoratti.net/11/10/pp_dao1.htm